The tables below give summary data for the 20-minute, 30-minute, and 60-minute service areas and for the counties (treated as service areas). In each table, totals for area, population of women 15–44, OB hospitals, and OB physicians are given for the rural OB regions, the urban OB regions, and for all OB regions. The percentages are based on state-wide totals. Also given are the overall ratio of OB physicians per 10,000 population for the rural OB regsions, the urban OB regions, and for all OB regions. Each table also gives the total area and population for the part of the state that does not fall into an OB service area. By definition, this region has no OB hospitals and no OB physicians.
20 Minute Service Areas
Type
Count
Area
Population
OBH
OBP
Ratio
Rural
18
7642 (14.6%)
117261 (12.2%)
18 (36.7%)
49 (11.1%)
4.18
Urban
18
4658 (8.9%)
474081 (49.4%)
31 (63.2%)
391 (88.9%)
8.25
Total
36
12301 (23.5%)
591342 (61.6%)
49 (100%)
440 (100%)
7.44
Outside
40120 (76.5%)
369278 (38.4%)
0
0
0
30 Minute Service Areas
Type
Count
Area
Population
OBH
OBP
Ratio
Rural
18
15352 (29.3%)
173480 (18.1%)
18 (36.7%)
49 (11.1%)
2.82
Urban
18
11948 (22.8%)
613931 (63.9%)
31 (63.2%)
391 (88.9%)
6.37
Total
36
27300 (52.1%)
787411 (82.0%)
49 (100%)
440 (100%)
5.59
Outside
25120 (47.9%)
173209 (18.0%)
0
0
0
60 Minute Servie Areas
Type
Count
Area
Population
OBH
OBP
Ratio
Rural
18
26620 (50.8%)
236771 (24.6%)
18 (36.7%)
49 (11.1%)
2.07
Urban
18
22018 (42.0%)
712955 (74.2%)
31 (63.2%)
391 (88.9%)
5.48
Total
36
48637 (92.8%)
949726 (98.9%)
49 (100%)
440 (100%)
4.63
Outside
3783 (7.2%)
10894 (1.1%)
0
0
0
Counties
Type
Count
Area
Population
OBH
OBP
Ratio
Rural OB
14
13425 (25.6%)
155317 (16.2%)
18 (36.7%)
57 (13.0%)
3.74
Urban OB
15
12004 (22.9%)
569166 (59.2%)
31 (63.2%)
383 (87.0%)
6.73
Total OB
29
25429 (48.5%)
724483 (75.4%)
49 (100%)
440 (100%)
6.10
Non OB
38
26992 (51.5%)
236137 (24.6%)
0
0
0
Charts
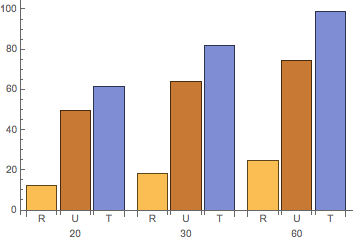
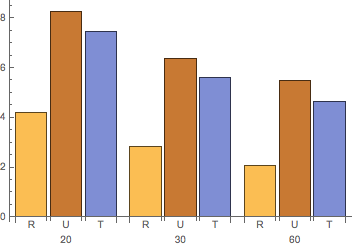
The first stacked bar chart below shows the percentage of the state population served by the rural OB regions, the urban OB regions, and all OB regions, for the 20-minute, 30-minute, and 60-minute service areas. The percentage is always smaller for the rural regions than the urban regions, but of course the percentages increase as the drive time increases. The second bar chart shows the ratio of OB physicians per 10,000 women aged 15–44 for the rural OB regions, the urban OB regions, and all OB regions, for the 20-minute, 30-minute, and 60-minute service areas.
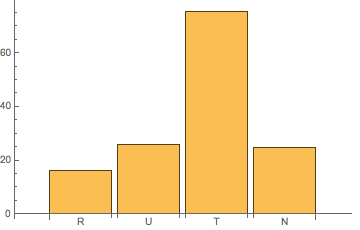
Population percentages of service areas by drive time and typeRatios (OBP/10000) of service areas by drive time and typePopulation percentages of counties by OB status and type
Conclusions
The use of service areas centered on hospitals that offer obstetric services and limited by drive times is better than the use of counties for evaluating access to obstetric care.
Like many states, Alabama does not have a deficiency of obstetric resources so much as a geographic mal-distribution of these resources. Far too many women of child-bearing age are too far away from a hospital with obstetric services.
Implications
The challenge to Alabama (and similar states) is how to correct the lack of geographical access. The days are over when every rural county had a small hospital, and every hospital delivered babies as a standard service. Possible solutions include
Remote prenatal monitoring, coupled with rapid transportation systems (by ground or air) in complicated or emergency cases.
Changes in scope of practice rules to allow assistance of well-trained nurse midwives, again with remote monitoring by OB physicians.
Restarting obstetrics in a few strategically chosen hospitals that do not now provide obstetric services.
Limitations
The data may not be completely accurate. The determination of physicians in Alabama that actually provide obstetric services is challenging. Even the determination of hospitals that provide obstetric care is surprisingly difficult.
Definitions of rural and urban are complex and challenging.
Barriers to access that involve race, ethnicity, poverty, and lack of insurance have not yet been considered.
Even when a rural OB hospital is available, with sufficient resources and geographically close, women will often choose to travel further to an urban hospital.